
Page 4 - NZPM Annual Report 2017
P. 4
NZPM GROUP ANNUAL REPORT 2017
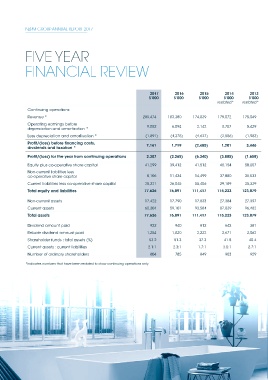
FIVE YEAR
FINANCIAL REVIEW
2017 2016 2015 2014 2013
$’000 $’000 $’000 $’000 $‘000
restated* restated*
Continuing operations:
Revenue * 200,474 183,380 174,839 179,072 175,049
Operating earnings before 9,052 6,094 2,142 3,757 5,429
depreciation and amortisation *
Less depreciation and amortisation * (1,891) (4,375) (4,627) (2,556) (1,983)
Profit/(loss) before financing costs,
dividends and taxation * 7,161 1,719 (2,485) 1,201 3,446
Profit/(loss) for the year from continuing operations 2,307 (2,265) (6,340) (3,885) (1,658)
Equity plus co-operative share capital 41,299 39,412 41,512 48,154 50,007
Non-current liabilities less
co-operative share capital 8,106 11,434 14,499 37,880 38,533
Current liabilities less co-operative share capital 28,221 26,045 55,406 29,189 35,339
Total equity and liabilities 77,626 76,891 111,417 115,223 123,879
Non-current assets 17,422 17,790 17,833 27,384 27,397
Current assets 60,204 59,101 93,584 87,839 96,482
Total assets 77,626 76,891 111,417 115,223 123,879
Dividend amount paid 922 940 812 642 381
Rebate dividend amount paid 1,254 1,830 2,232 3,671 3,062
Shareholder funds : total assets (%) 53.2 51.3 37.3 41.8 40.4
Current assets : current liabilities 2.1:1 2.3:1 1.7:1 3.0:1 2.7:1
Number of ordinary shareholders 804 785 849 903 929
*Indicates numbers that have been restated to show continuing operations only.
2